For civil engineers and other design professionals, contours are a significant part of our working life. This is because contours are very useful when attempting to visualize drainage patterns across the landscape. Unfortunately, contour data (and especially high-quality contour data) can be difficult to find. Some cities and counties provide contour data on their GIS website. However, it is often necessary to generate contours yourself. Throughout my career, I have used ArcGIS to convert United States Geological Survey (USGS) digital elevation models (DEMs) to contours. Unfortunately, an ArcGIS license is costly, so many people cannot access the program. If you are not an ArcGIS user, there is still hope! There is an open-source geographic information system (GIS) program called QGIS that makes it possible for anyone to convert raster data to contours. In the following blog post, I will discuss where you can find data, how to process the raster data in QGIS, and provide a brief overview of how to style the contours. If you would like to learn more about the differences between QGIS and ArcGIS, check out this blog post. Otherwise, read on to learn how to generate contours using freely available data and freely available software!
Step 1: Downloading Raster Data
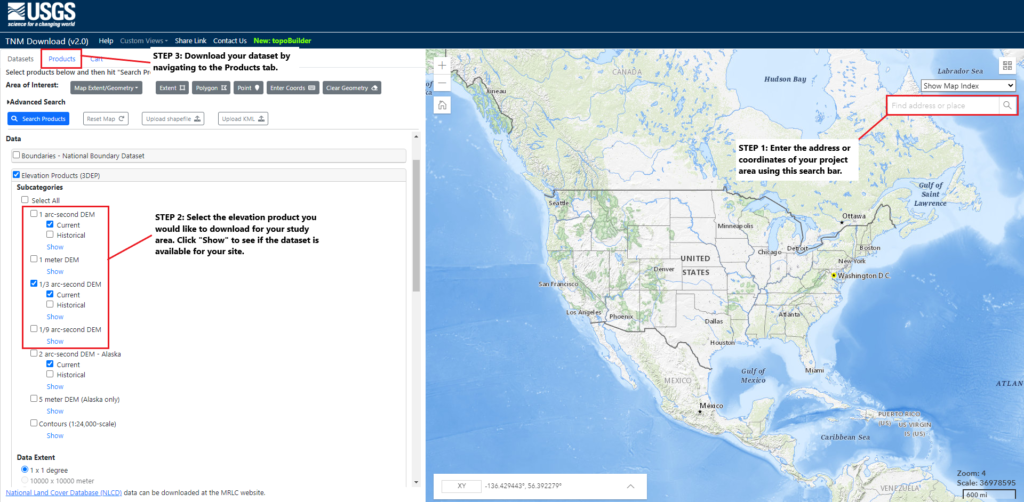
Assuming you have QGIS installed on your machine, the first step in this process is to download raster data. Unless something better is available, I recommend using data from the USGS National Elevation Dataset (NED). The NED is USGS’s primary elevation dataset. The spatial resolution of the data available differs slightly depending on the geographic location within the United States. Nearly everywhere is covered by a DEM with a spatial resolution of 1/3 arc-seconds (about 10 meters). However, there are places with one-meter data available. In most cases, it is best to use the data with the finest spatial resolution available. If you are working on a project that requires analyzing a large area (many square miles), it is worth considering a dataset with a coarser spatial resolution. This is especially true if file size and computational power are a concern. NED rasters can be obtained from The National Map, Version 2 (TNM 2). Simply put “TNM version 2” into your search engine to access the website. The image below demonstrates how to download raster data from the website.

OpenTopography and the USGS Earth Explorer are other good sources of raster data.
Note: NED rasters (and other datasets you find on the internet) are NOT a substitute for surveys! While NED rasters work well for analysis purposes, it is always recommended that you obtain a survey for grading and drainage design.
Step 2: Processing the Raster Data in QGIS
After downloading the data on your computer, it is time to process the raster in QGIS. The following video demonstrates how to process raster data in QGIS. The steps below explain what is taking place in the video. If you follow along with the video, note that you will need to download the QuickMapServices Plugin to view the Bing Satellite imagery.
Step 2-1: Define Projection for the QGIS Project.
The default projection in QGIS is WGS 1984. If you want to work in a different projection, click File –> Properties.
Step 2-2: Project the DEM if necessary
The 1/9 arc-second, 1/3-arc-second, and 1-arc-second DEMs are in geographic coordinates (WGS 1984). One-meter DEMS are in Universal Transverse Mercator (UTM). If you are working in another coordinate system like State Plane.
Step 2-3: Convert from Meters to Feet
USGS DEMs are in meters. To convert to feet, use the Raster Calculator tool (Raster -> Raster Calculator) to multiply your raster by 3.28084.
Step 2-4: Extract Contours
Finally, extract contours by going to Raster -> Extraction -> Contour.
Step 3: Styling
The video below describes how to style contours so they look nice.
Final Thoughts
The following list consists of some tips for converting rasters to contours:
- Select a contour interval that is appropriate for the dataset. For example, a one-foot contour interval is probably too small for a DEM with a spatial resolution of 30 meters.
- Be mindful of the size of the DEM you are using. It will take QGIS a while to convert a large dataset to contours, assuming the program does not crash.
- Contours generated from DEMs will often have a “boxy” appearance. Smooth the DEM or the final contours to make them look nicer.
- Contours generated from DEMs work well for analysis, but they should not be used for final design!