Sediment transport is the “brown” side of HEC-RAS modeling, which involves determining how sediment is transported along a stream. In my experience, sediment transport analyses are performed for projects associated with streams/channels that are aggrading and degrading. It is important to model such streams to ensure that they do not cause damage to nearby infrastructure. Sediment transport models help engineers understand a stream’s pattern of sedimentation so that bridges, bank protection, and grade control structures can be designed and constructed in a way that minimizes the chance of structural failure.
Sediment transport can be complicated due to the uncertainty involved. An engineer must use their judgment and run a variety of scenarios when performing a sediment transport analysis. Some even joke that sediment transport was too difficult for even Albert Einstein.
Albert Einstein’s son, Hans Albert Einstein, was a famous hydraulic engineering professor who developed important equations for sediment transport in rivers. When reporters asked Albert what he thought of his son’s career, he replied, “He is working on a more difficult problem.”
What is a sediment rating curve?
A sediment rating curve depicts the relationship between sediment load and water flow in a channel or stream.
To perform a sediment transport analysis, it is important to understand the relationship between sediment load (tons/day) and water flow (cfs). In some cases, sediment rating curves are generated from actual stream data. This often involves fitting a curve to depict the relationship between river discharge (Q) and suspended-sediment concentration (C). However, in many cases, such sediment data is not available. In such instances, the engineer should obtain sediment samples of the bed material and develop a sediment gradation curve. This is important because many sediment transport equations require at least one representative grain size with the most common being D50.
For a channel modification project, it is often sufficient to only evaluate the bed load, so a sediment rating curve will only reflect the suspended bed material. The bed load is comprised of particles moving in the water column and also in the bed material. The bed load refers to heavier particles that cannot be held in suspension but move in contact with the stream bed. Bed load is often estimated as 5-15% of the total sediment load (USACE, 1990).
For reservoir deposition analyses, a full rating curve that includes the wash load should be developed. The wash load contains particle sizes smaller (<0.0625 mm) than those found in the stream bed. The wash load is a function of upstream characteristics (sediment supply), and it remains suspended unless the stream velocity approaches zero (such as in a reservoir).
Sediment Transport Equations in HEC-RAS
Sediment transport equations are typically developed for the purpose of developing a sediment rating curve for only the bed load. There are various equations for sediment transport that are appropriate for different ranges of sediment gradation.
The following table lists the parameter ranges for the HEC-RAS 1D sediment transport functions. It should be noted that there have been studies that successfully apply these equations outside of the range specified below. The United States Army Corps of Engineers (USACE) Waterways Experiment Station in Sediment Analysis Methods (SAM) computer program (specifically SAM.aid) helps users select an appropriate sediment transport equation based on the sediment gradation and various hydraulic parameters.
| Function | Particle Diameter (mm) | D50 (mm) | Sediment Specific Gravity | Average Channel Velocity (ft/s) | Channel Depth (ft) | Hydraulic Radius (ft2/ft) | Friction Slope | Channel Width (ft) | Water Temperature (°F) |
| Ackers White | 0.04-7.0 | N/A | 1.0-2.7 | 0.07-7.1 | 0.01-1.4 | N/A | 6×10⁻⁵ – 0.037 | 0.23-4.0 | 46-89 |
| Engelund-Hansen | N/A | 0.19-0.93 | N/A | 0.65-6.34 | 0.19-1.33 | N/A | 5.5×10⁻⁵ – 0.019 | N/A | 45-93 |
| Laursen-Copeland | N/A | 0.08-29 | N/A | 0.068-9.4 | 0.03-54 | N/A | 2.1×10⁻⁵ – 0.025 | 0.25-3640 | 32-93 |
| Meyer-Peter-Muller | 0.4-29 | N/A | 1.25-4.0 | 1.2-9.4 | 0.03-3.9 | N/A | 4×10⁻⁴ – 0.02 | 0.5-6.6 | N/A |
| Toffaleti | 0.062-4.0 | 0.093-0.91 | N/A | 0.7-7.8 | N/A | 0.07-56.7 | 2×10⁻⁶ – 0.019 | 0.6-3640 | 40-93 |
| Yang | 0.15-7.0 | N/A | N/A | 0.8-6.4 | 0.08-0.72 | N/A | 4.3×10⁻⁵ – 0.029 | 0.4-1750 | 32-94 |
Each of these equations is discussed in more detail below.
Ackers-White
The Ackers-White sediment transport equation (Ackers and White, 1973) was developed based on a study conducted with more than 1,000 laboratory flumes. The function is applicable for noncohesive sands and for beds with ripples and dunes. Later research shows that Ackers and White can be used for bed materials up to 7 mm.
Engelund-Hansen
The Engelund-Hansen sediment transport equation (Engelund, 1966, Engelund and Hansen, 1967) was based on flume data and sediment with four D50 values (0.19 mm, 0.27 mm, 0.45 mm, and 0.93 mm). This sediment transport function works best for sand-bed streams with a significant suspended sediment load. The bed material should also have a minimum particle diameter of 0.15 mm (or greater). This equation also works well for dunes.
Laursen-Copeland
The Laursen-Copeland equation (Laursen, 1958; Copeland, 1989) was developed for sand-bed streams. It is based on the work of Laursen (1958) which was based on flume data supplemented with field observations. Later, Copeland (1989) expanded upon Laursen’s work to include gravels up to 29 mm.
Meyer-Peter-Muller
The Meyer Peter Muller (MPM) equation (Meyer-Peter and Muller, 1948) is based on flume data. It has been widely applied to rivers with coarse bed material. This equation should not be applied to rivers and streams with a significant amount of suspended sediment.
Toffaleti
The Toffaleti equation (Toffaleti, 1968) was developed for sand-bed streams. It is based on a study involving a combination of flume and actual stream data. The stream data was obtained from gage sites located along the Mississippi River, the Rio Grande River, the Middle Loup River, the Niobrara River, and three streams situated within the Lower Mississippi River Basin. The flume data included median particle diameters ranging from 0.3 to 0.93 mm. This equation has been applied to sediment transport studies with median particle diameters as small as 0.095 mm with good results. The upper limit for applying the Toffaleti equation is 4 mm.
Yang
The Yang sediment transport equation (Yang, 1973) is also referred to as the Yang Stream Power Function. It was developed from both flume and actual stream data for sand-bed streams. In 1984, Yang expanded upon his method to include gravel-bed streams.
Applying the Equations in HEC-RAS
To apply the equations discussed above, open the Sediment Transport Capacity Window, which is located in the Hydraulic Design tab. Then click “Type” and select “Sediment Transport Capacity.” Multiple equations can be applied at once in the Sediment Transport Capacity Window.
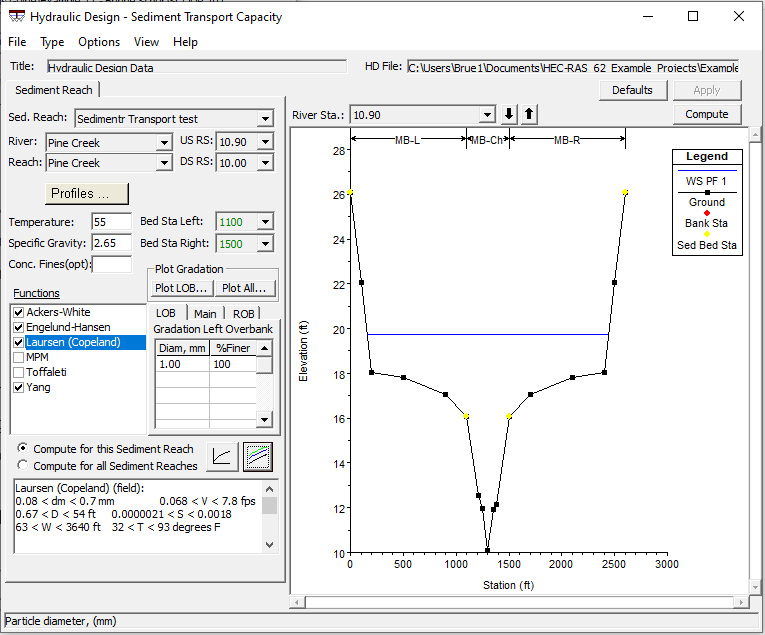
In the Sediment Transport Capacity window, the user defines the Sediment Reach (US RS and DS RS) and inputs the gradation of the bed material. The computed relationships may be viewed by clicking either of the two buttons below the gradation table.
How is a sediment rating curve used?
A sediment rating curve generated in HEC-RAS could be used as an input into a sediment transport program such as HEC-6.
About HEC-6
The United States Army Corps of Engineers (USACE) HEC-6, Scour and Deposition in Rivers and Reservoirs program (USACE, 1993) has been the most widely used sediment transport model in the United States since its release. The program is a 1D, gradually varied, steady flow simulation. Sediment transport between cross-sections is calculated, with gains or losses to the transported sediment. Then the geometry is modified such that elevations are increased if deposition occurs and decreased if scour occurs. Although the sediment calculations are based on a steady flow simulation, a long-term hydrograph is generated by modeling a series of time steps.
Sediment Rating Curve Analysis Tool in HEC-RAS
The Sediment Rating Curve Analysis Tool is a new feature in HEC-RAS version 6.2. This tool downloads sediment loads, concentrations, and gradations from the United States Geological Survey (USGS). Alternatively, the user can upload this data from a text file or Excel spreadsheet. Then the Sediment Rating Curve Analysis tool applies a variety of statistical analyses to help the user develop an appropriate sediment rating curve. This video is a demonstration of how to use this tool.