In 2020, I decided to open an Etsy shop selling some of my digital art, specifically hydrological maps. Over the last couple of years, this hobby has grown into a part-time business that has become a solid source of extra cash. Building my little business has taken a lot of work. In addition to learning about the Etsy platform and selling to customers, I needed to hone my QGIS skills and learn Adobe Photoshop in order to create maps with the look I wanted. The following blog post will discuss why I chose to sell hydrological maps and will summarize how I create my hydrological maps in QGIS and Adobe Photoshop today.
What is a Hydrological Map?
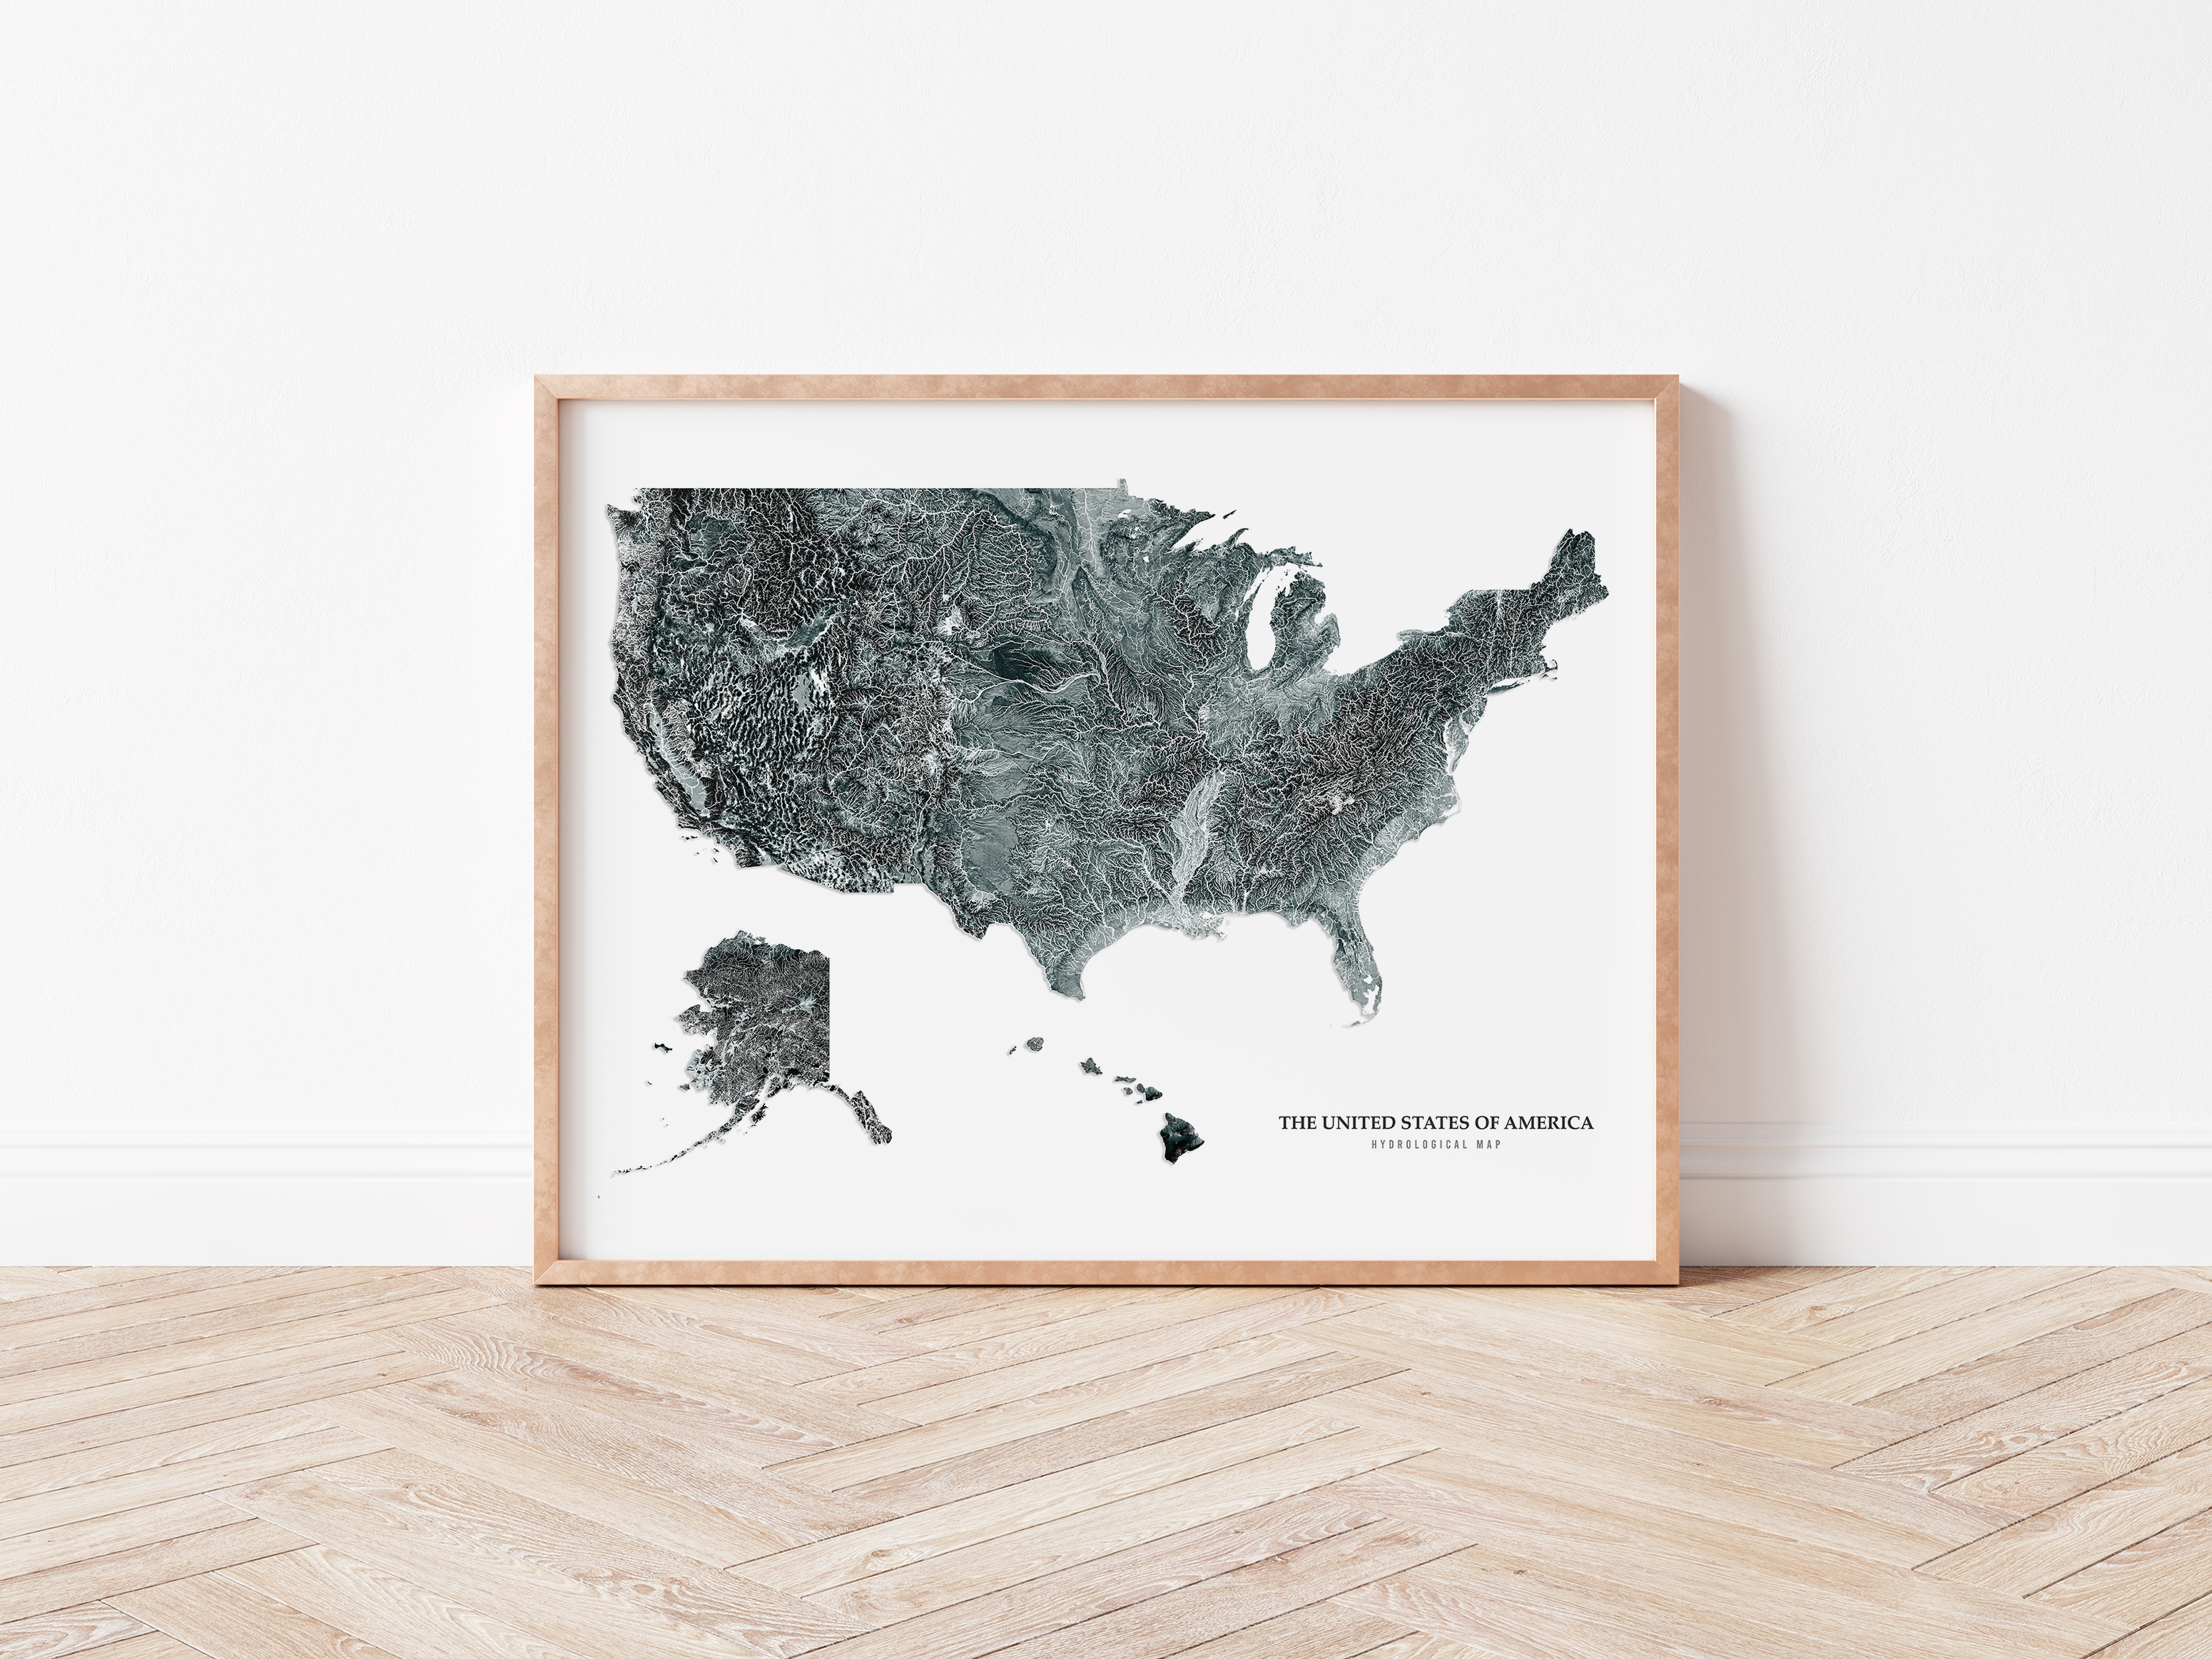
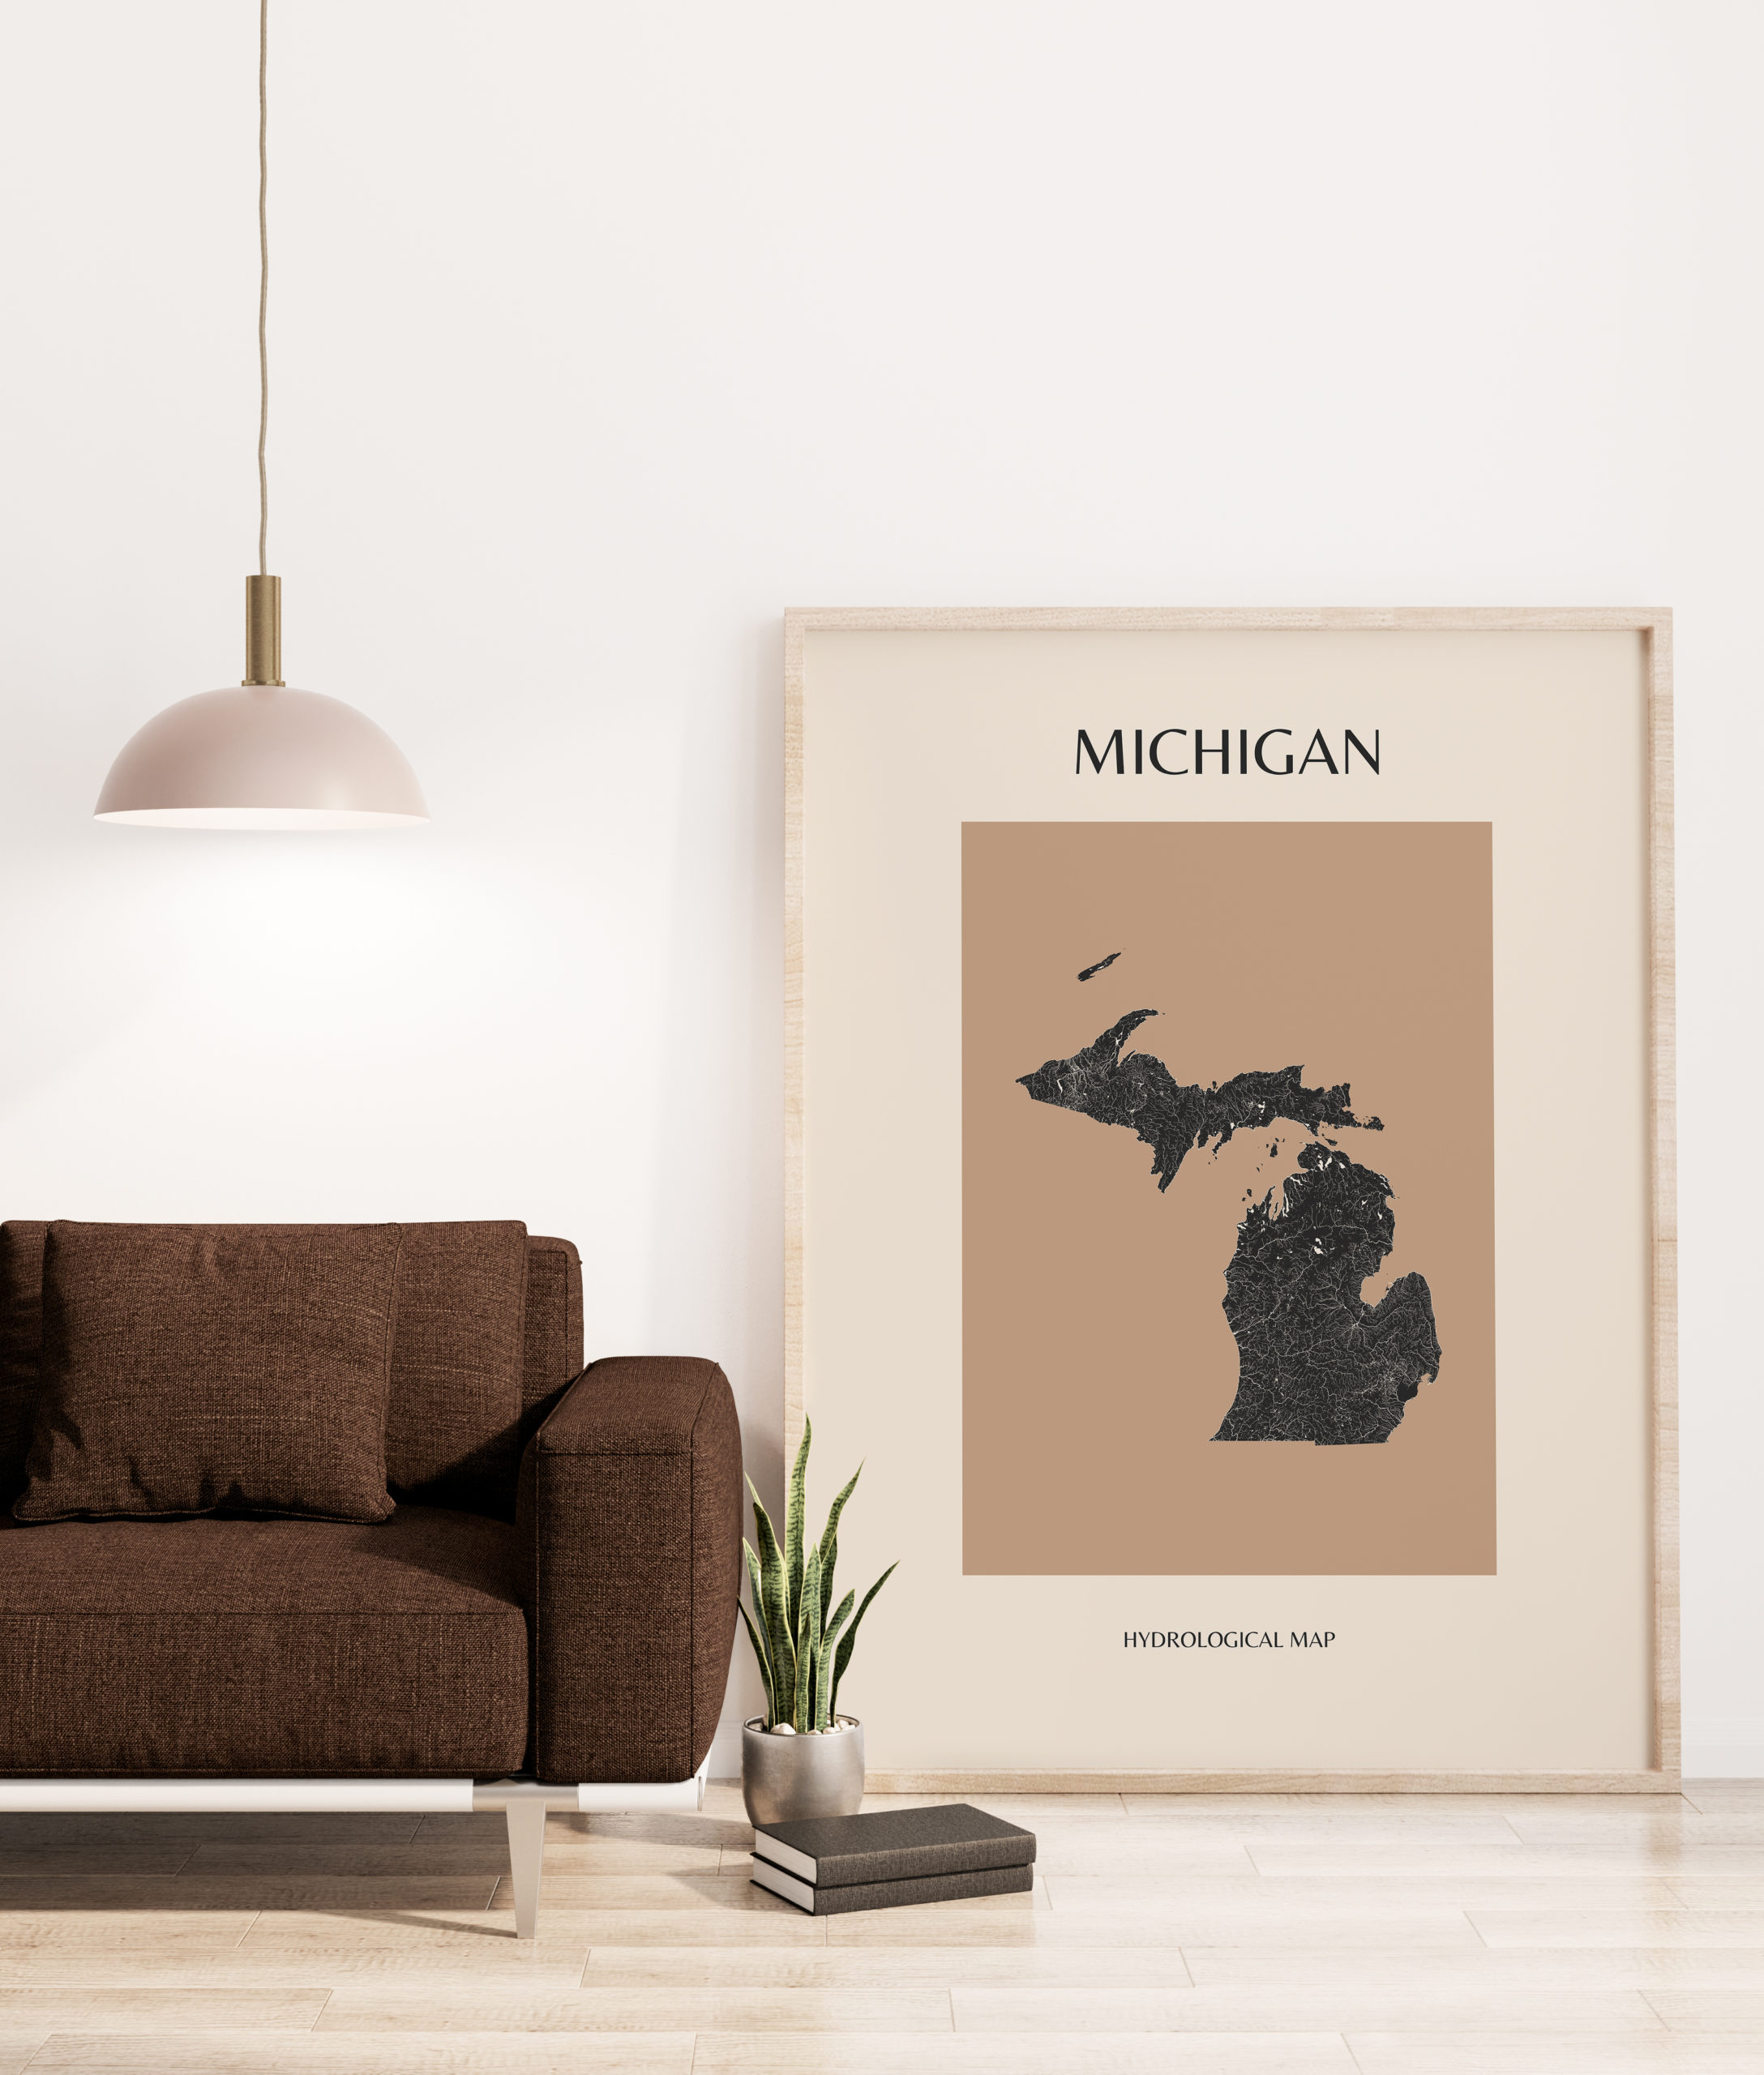
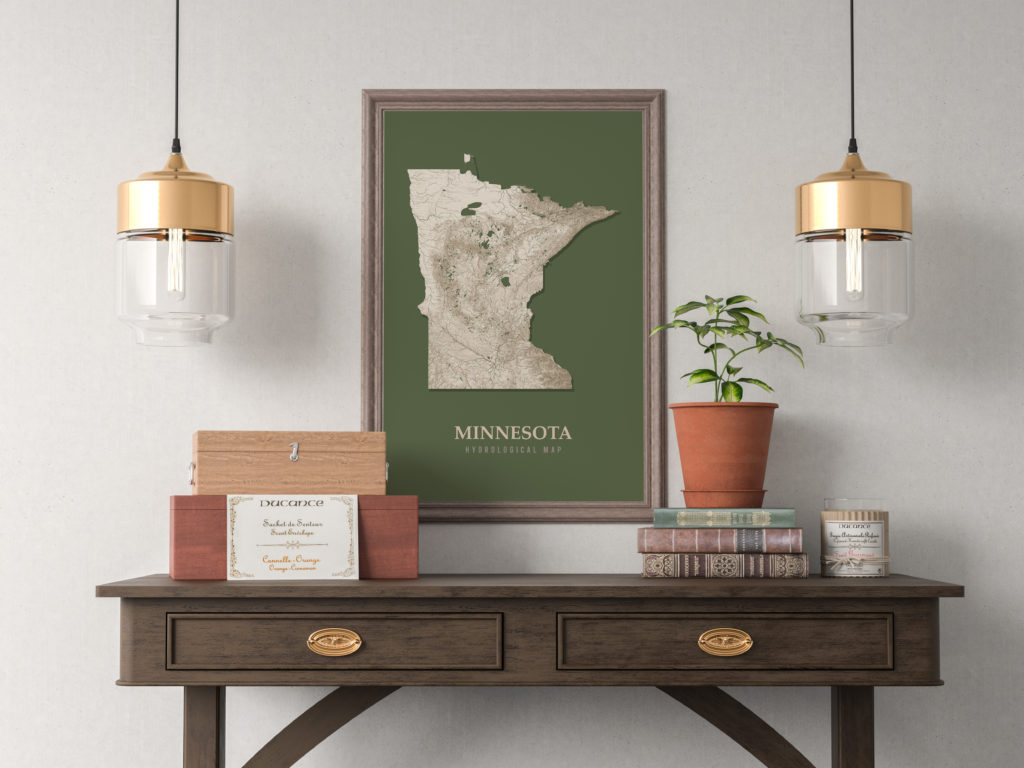
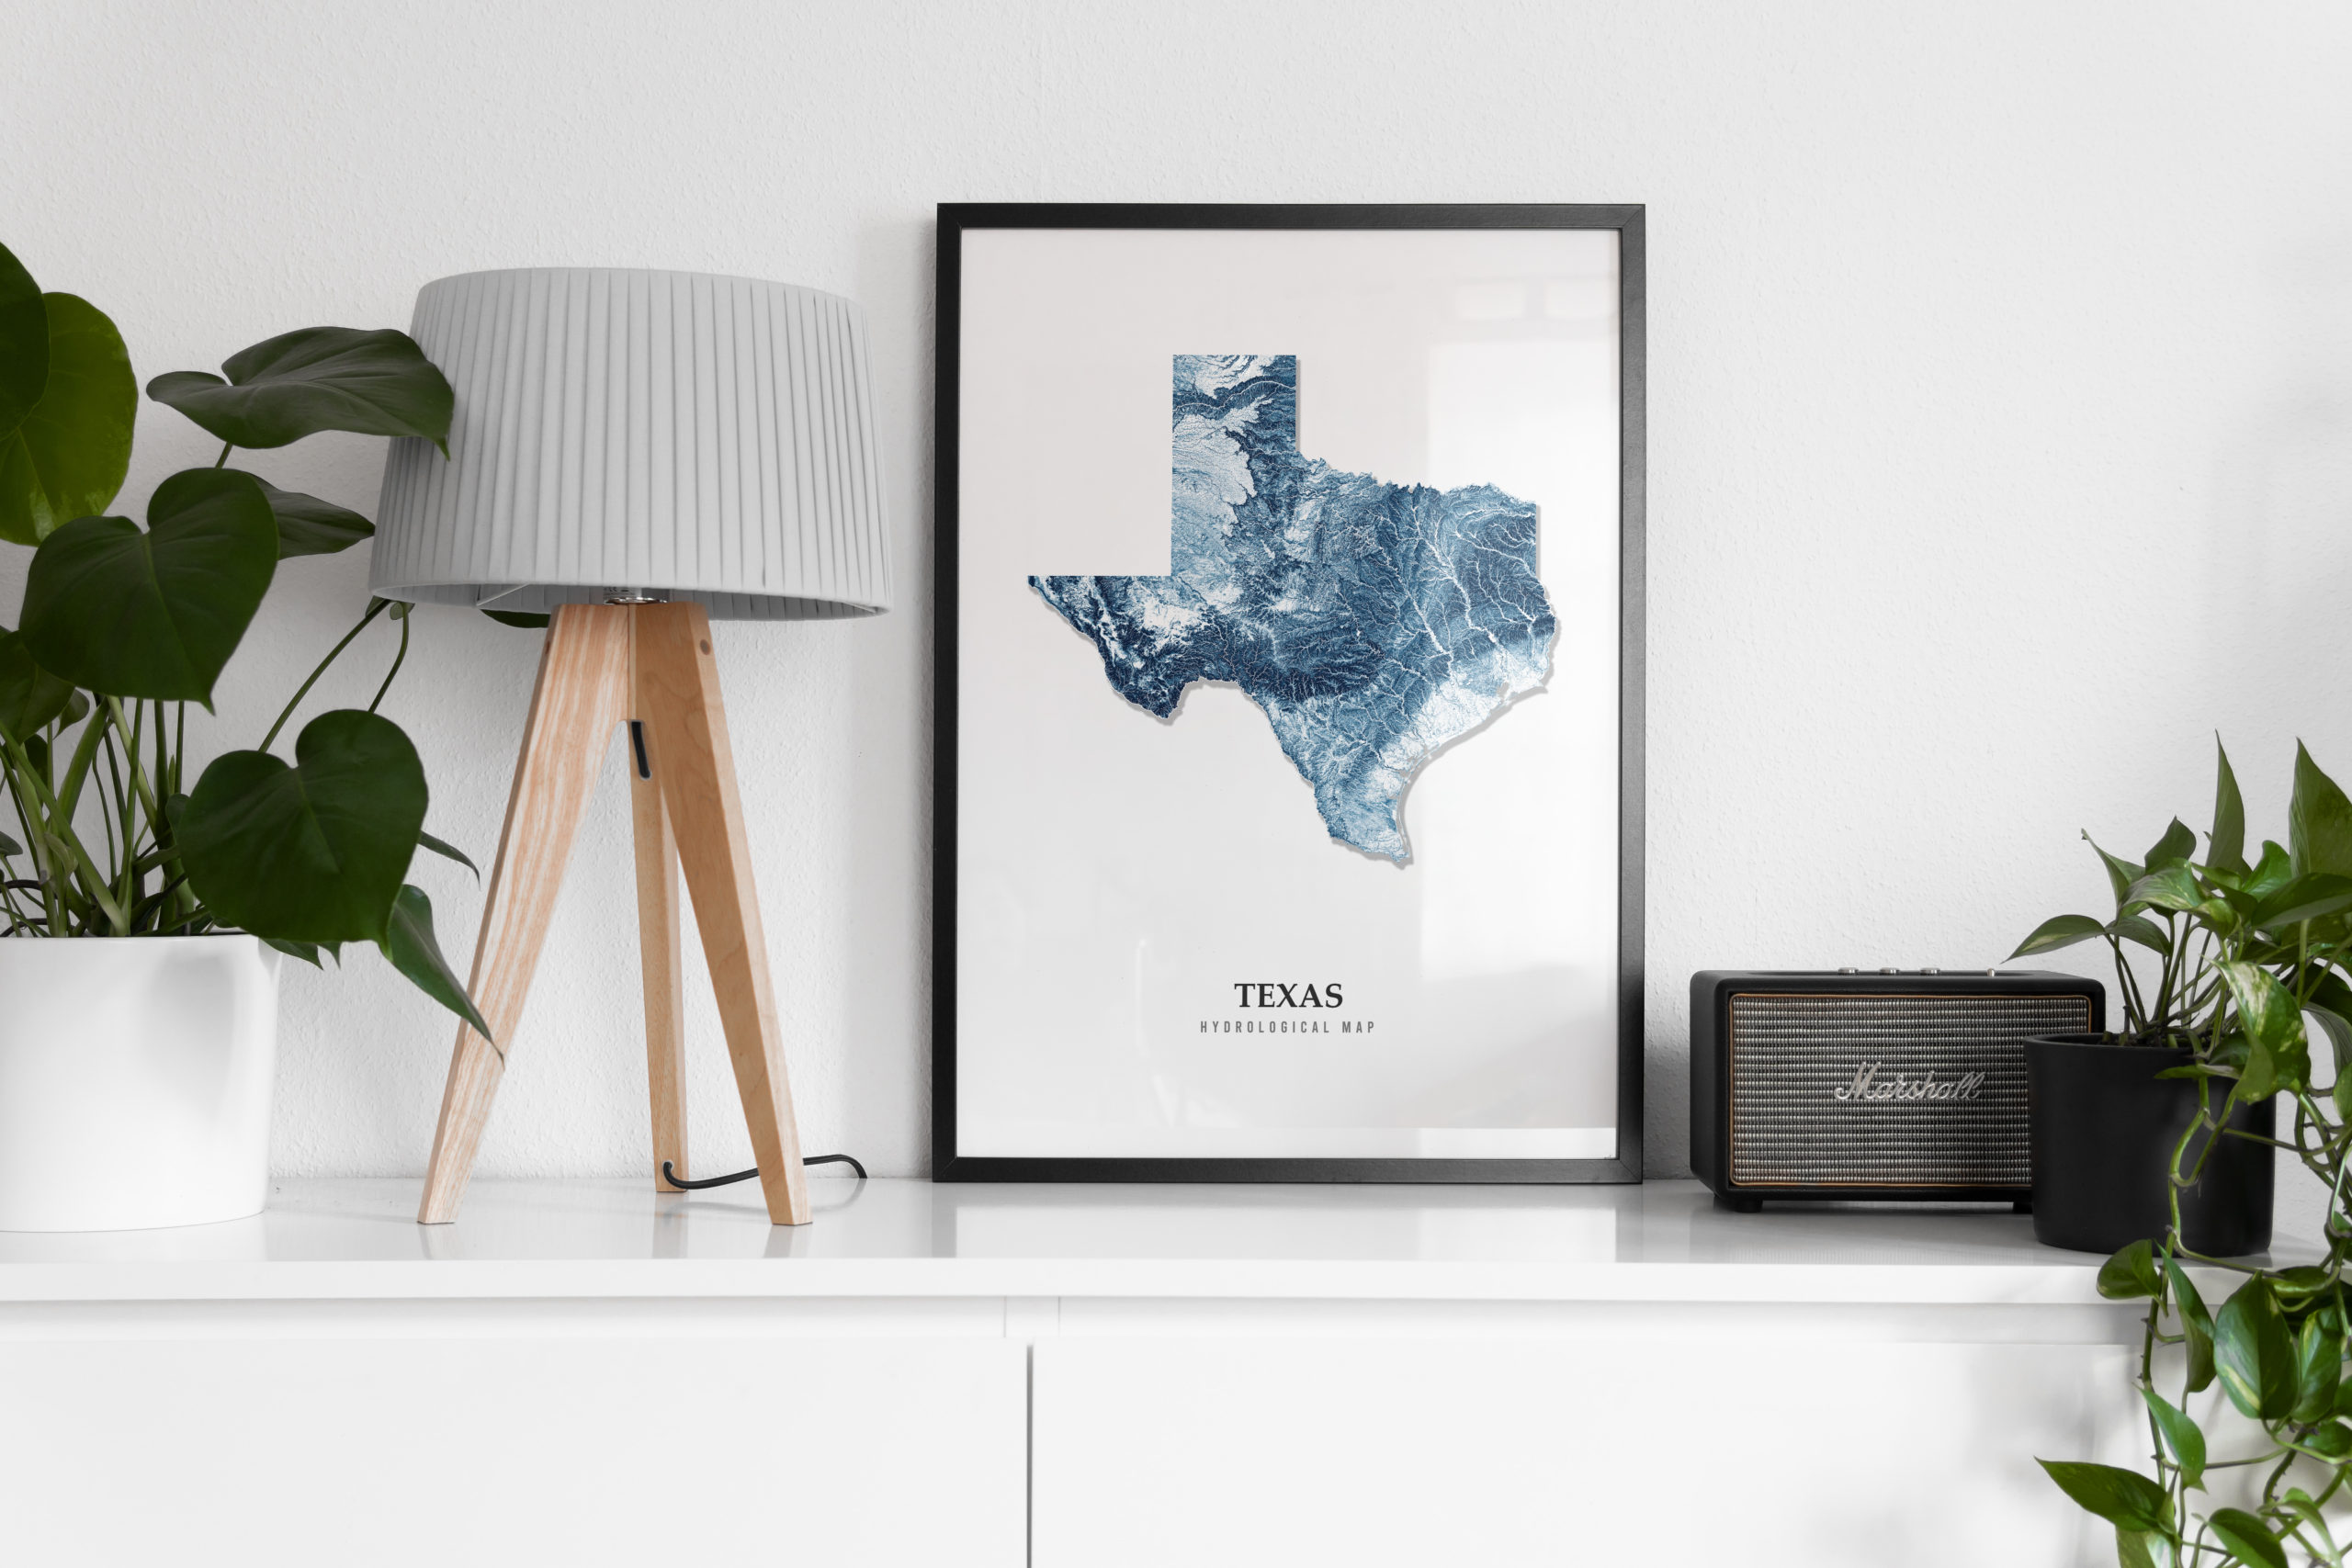
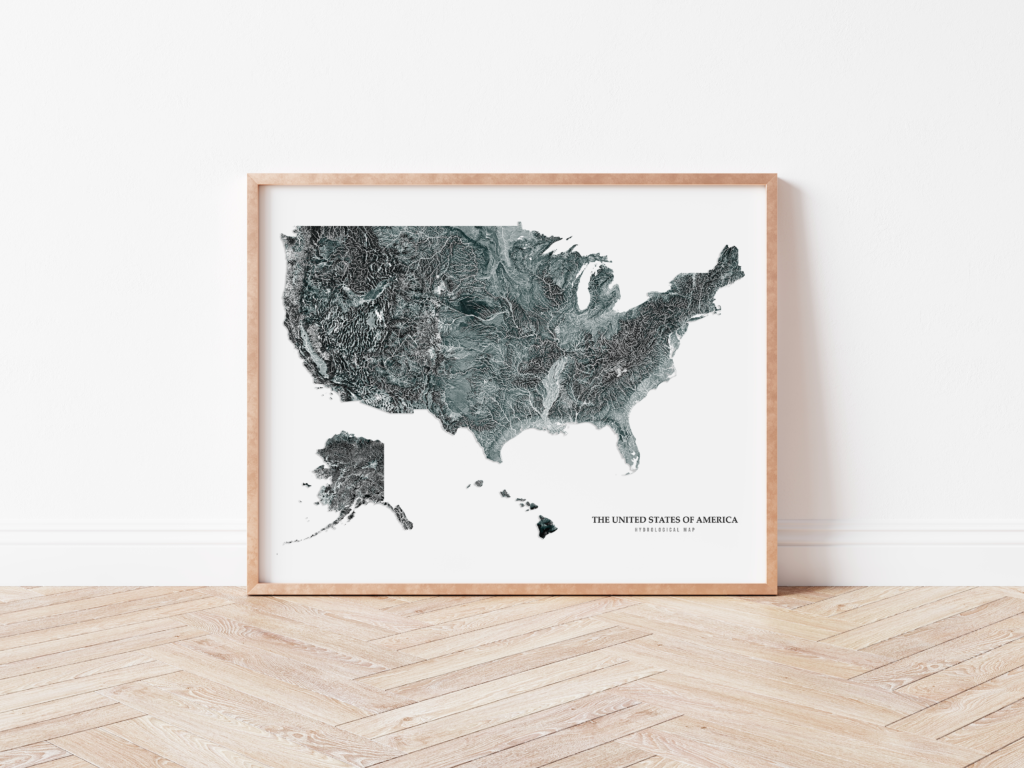
Hydrological maps graphically show the streams, rivers, and water bodies for a certain geographic location. Water resources professionals use such maps to delineate watersheds and to communicate the results of various analyses. In addition, hydrological maps can be an effective communication tool for scientific, educational, and socio-political purposes. In this way, these maps have the potential to play an important role in addressing many of the environmental and social problems (e.g., acid precipitation and climate change) that our world faces today (McKay, 1976). Some examples of the hydrological maps available in my shop (Maps By Paige) are shown below.
Why hydrological maps?
You may be wondering why I chose to open an Etsy shop that sells hydrological maps. When I first opened my shop, I thought they would be super unique. However, when I was looking at my potential competitors, I was surprised to find that there were already a couple of other online shops that sell hydrological maps. After reading the reviews, it became apparent that many people who love the outdoors (like me) enjoy displaying hydrological maps as art. It also seems like many customers purchase hydrological maps as a gift for retiring engineers and hydrologists.
I also find hydrological maps to be very beautiful. When shown on a map, it becomes very apparent how important water, streams, and lakes are to sustaining life. Hydrological maps show how streams carve across the landscape, delivering water for us to drink, grow food, and sustain businesses. Just as our blood vessels deliver blood and oxygen to the organs in our bodies, water delivers life.
Creating Hydrological Maps in QGIS and Adobe Photoshop
When creating hydrological maps for my shop, I use QGIS to generate an image of the streams/waterbodies and an image of the state. Then I use Adobe Photoshop to further manipulate and refine the images to create an aesthetically pleasing map.
To create my hydrological maps, I used data available on the United States Geological Survey (USGS) National Map Data Download website. It is possible to generate flow lines using a workflow similar to the one available in the Arc Hydro toolset (e.g., fill sinks, flow direction, flow accumulation, stream definition, etc.). Because I was creating state hydrological maps, it was not practical to download DEMs of the entire United States and generate the associated flow lines when there was already data freely available. The following section will discuss some freely available hydrological data sources.
Where to find hydrological data
As previously mentioned, I used freely available data from the USGS to create my hydrological maps. However, it is worth noting that there are other data available. Some of these datasets are described below.
National Hydrography Dataset (NHD)
The National Hydrography Dataset (NHD) represents the water drainage network of the United States with features such as rivers, streams, canals, lakes, ponds, coastlines, dams, and stream gages. The NHD is the most up-to-date and comprehensive hydrography dataset for the United States of America (USA). In addition, the NHDPlus High Resolution (NHDPlus HR) dataset is available for most of the United States. These datasets contain Strahler stream numbers, and this information was used to adjust line thickness based on the size of the stream.
HydroSHEDS
The HydroSHEDS database contains a variety of digital data layers in support of hydro-ecological research and applications worldwide. Its various hydrographic data products include catchment boundaries, river networks, and lakes at multiple resolutions and scales. HydroSHEDS datasets are freely available in standard GIS formats. In addition, the HydroSHEDS database contains sub-basin boundaries (HydroBASINS), river reaches (HydroRIVERS), and lake shorelines (HydroLAKES).
Local Data
Some municipalities have their own GIS portals that contain various datasets. In some cases, these municipalities provide stream and waterbody data in their GIS portal. These local datasets are often more spatially refined than national datasets like NHD.
How to create a hydrological map in QGIS using NHD data
Prior to starting my Etsy shop, I had some experience using ArcGIS, but I had never used QGIS. Being familiar with ArcGIS definitely helped me learn QGIS fairly quickly. However, I did still have to get over a steep learning curve because, although QGIS and ArcGIS are similar in some ways, they differ in others. All this to say, it is important to be patient when learning a new software program, even if it is similar to another program you are proficient at using.
Streams and Waterbodies
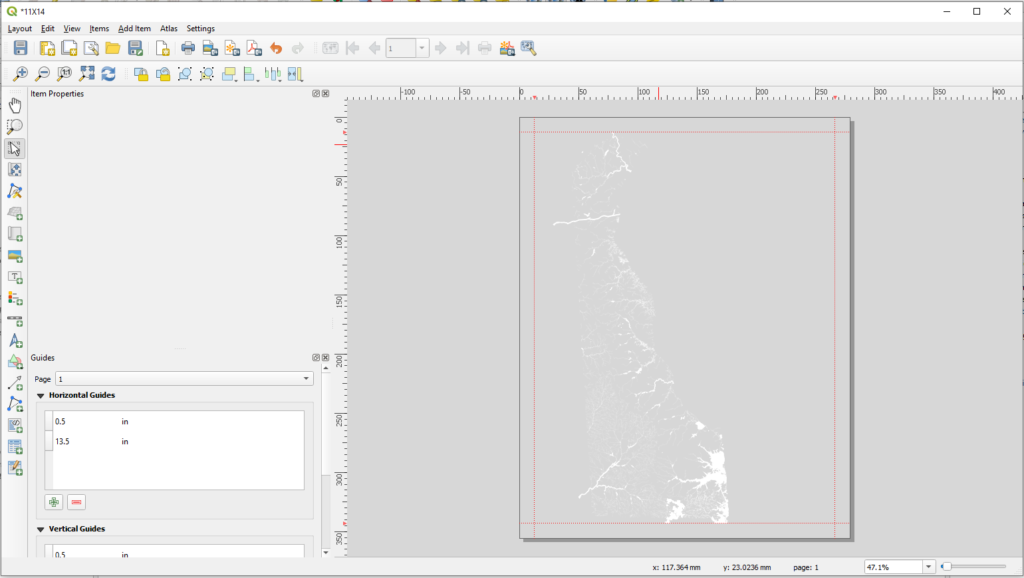
When developing a hydrological map, I first use QGIS to graphically present the stream data. As previously mentioned, the thickness of each flow line shown on my hydrological maps is based on Strahler’s stream order. Strahler’s stream ordering system is a well-known classification system based on stream/tributary relationships. Upstream channels in a drainage network (i.e., headwater channels with no upstream tributaries) are designated as first-order streams down to their first confluence. A second-order stream is formed below the confluence of two first-order channels. Third-order streams are created when two second-order channels join, and so on. Streams of lower order are presented as thinner lines than streams of higher stream order. In many cases, I do not show the first-order flow lines because the maps get too busy. Next, I created a “New Print Layout” and centered my styled stream data in the layout. Finally, I exported the stream data with a transparent background (transparency in Page Properties).
Hillshade Elevation Map
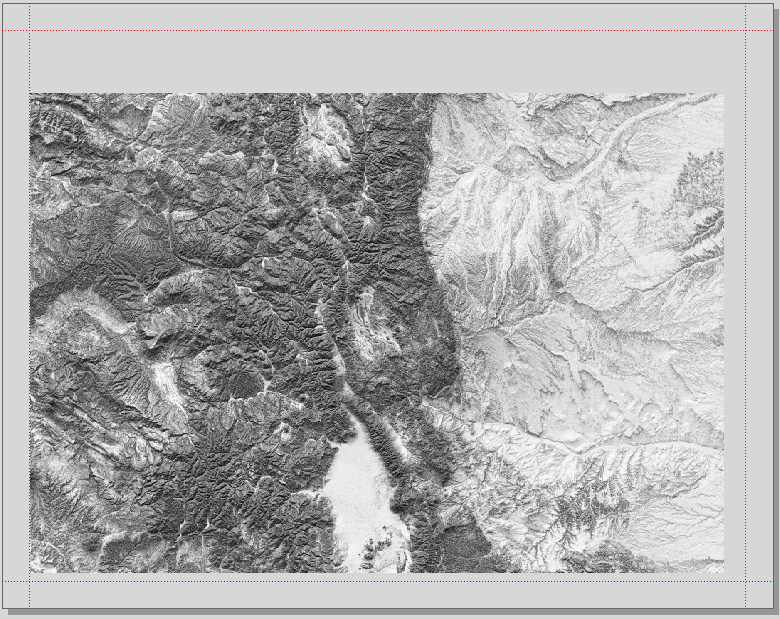
To generate the hillshade elevation map that makes up the background of my hydrological maps, I first downloaded DEMs (1 arc-second) from the USGS National Map Data Download website. Then I combined the rasters and clipped the combined raster to the state boundary. Finally, I used the Batch Hillshader QGIS Plugin to create a hillshade map. Before exporting the map, I changed the resampling method for zoomed out to “Average.” When exporting the hillshade elevation map, I used the same layout used to export the stream layer. This ensures that the stream layer will fit over the elevation map in Photoshop.
Note: hillshade is a grayscale 3D representation of the surface, with the sun’s relative position taken into account for shading the image. This function uses the altitude and azimuth properties to specify the sun’s position.
Using Adobe Photoshop to Create the Final Map
After exporting the data described in the previous section, I used Adobe Photoshop to create the final map products because Photoshop has many more styling options than QGIS. Prior to using Photoshop for the maps in my Etsy shop, I did not have any experience with any Adobe products (except for PDF readers). As a result, there was a steeper learning curve associated with learning Photoshop than learning QGIS. To learn Photoshop, I watched numerous YouTube videos and read through the tutorials published on the Adobe website.
Adobe Photoshop has the reputation of being expensive software. Luckily, there are some affordable options available through Adobe Cloud. For my maps, I pay for the Adobe Photography Plan with 20 GB of storage, and it costs $9.99/month. I could not find any current information about this plan on the Adobe website, but it looks like there is an Adobe Photography Plan with 1 TB of storage available for $19.99/month.
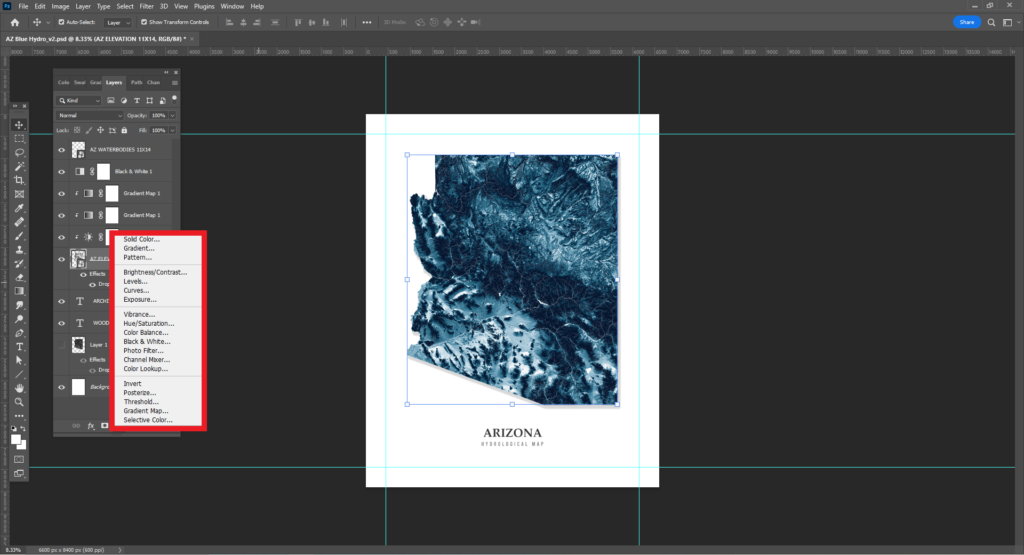
To create my final maps, I use Adjustment Tools to change the look of the map. Adjustments are a group of editing tools that can be used to manipulate color and tone without permanently changing the image you are editing. I most often use the Brightness/Contrast tool, the Gradient Map tool, and the Vibrance tool. In addition, I like to add a drop shadow to the hillshade elevation map to give the image a 3D appearance.
Text
I use fonts available through Google Fonts for the titles of my maps. I like using these fonts because they are free to use and they have a clean appearance.