A hydrograph represents the flow rate over time at a particular geographic location. Hydrographs can be used to show how watersheds respond to changes in the watershed. For example, a watershed with a significant amount of impervious area will produce a skinnier hydrograph with a higher peak flow. In contrast, an undeveloped watershed will tend to generate a fatter hydrograph with a smaller peak flow. Hydrologists and engineering consultants use hydrologic modeling software such as HEC-HMS to generate hydrographs that serve as inputs for hydraulic models in HEC-RAS.
Hydrographs can be classified as natural or synthetic. A natural hydrograph is generated based on flow data. In contrast, a synthetic hydrograph is generated based on watershed parameters and design storm characteristics. Most watersheds are ungauged, so it is important that hydrologists and water resources engineers understand how to generate a synthetic hydrograph. In many cases, a unit hydrograph is an important intermediate step to generating a hydrograph. The following blog post will define the term unit hydrograph and describe the steps involved in developing a synthetic hydrograph using unit hydrographs.
What is a unit hydrograph?
Sherman (1932) first proposed the concept of a unit hydrograph. Today, it is widely used by hydrologists and water resources professionals. A unit hydrograph represents the direct runoff produced by one inch of effective rainfall falling uniformly in time and space over a drainage basin during a specific period of time. The concept of a unit hydrograph is somewhat abstract. One way to visualize what a unit hydrograph represents is a sprinkler system that uniformly distributes one inch over a drainage area. The sprinklers will apply water at a constant rate until exactly one inch of runoff is generated. Then the sprinklers shut off instantaneously after a specified period of time.
“if a given one day rainfall produces a 1-inch depth of runoff over the given drainage area, the hydrograph showing the rates at which the ruonff occurred can be considered a unit graph for that watershed.”
Sherman, 1932
A unit hydrograph can be developed based on flow data or based on design data. Once a unit hydrograph is established for a particular drainage area, this information can be used to generate runoff hydrographs for various rainfall events because unit hydrograph methodology assumes that the runoff response of a drainage area is directly proportional to the effective rainfall input. In other words, the concepts of proportionality and superposition can be applied. The next section of this blog post describes some of the common unit hydrograph methods. These methods are options in HEC-HMS.
Clark Unit Hydrograph
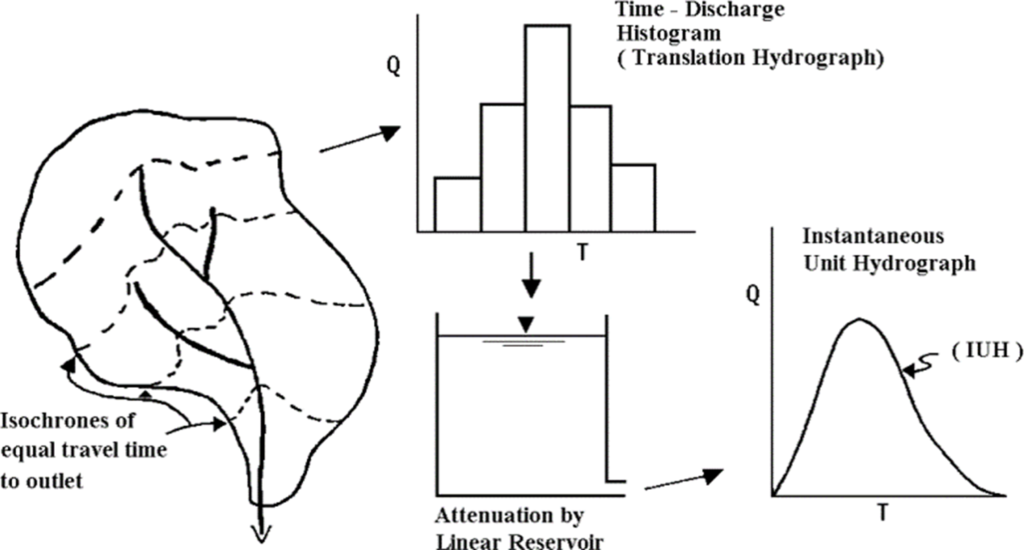
The Clark Unit Hydrograph methodology involves developing a unit hydrograph based on two critical processes: translation and attenuation. In this context, translation is defined as excess runoff flowing via gravity to the watershed outlet. Translation is modeled using a time-area curve. The time-area curve is created by dividing the watershed into regions of equal runoff time. Once the areas are divided, the runoff from each watershed subdivision part of is delayed by a proportion of the time of concentration.
The second process is attenuation which is the reduction of the flow rate due to frictional forces or storage within the channel or basin. To learn more about flow attenuation, check out this blog post. The attenuation effects are modeled using a parameter called the storage coefficient (R). The storage coefficient is a coefficient that represents the temporary storage of precipitation excess in the watershed as it drains to the outlet point. Greater R values indicate that excess runoff remains in storage longer.
The following image illustrates how the process of translation and attenuation is used to develop the Clark Unit Hydrograph.
Snyder Unit Hydrograph
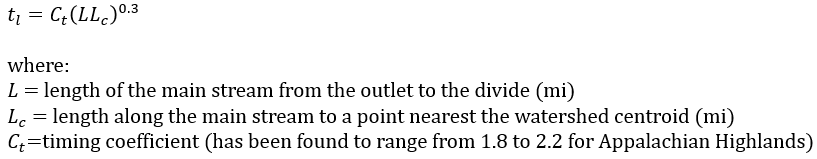
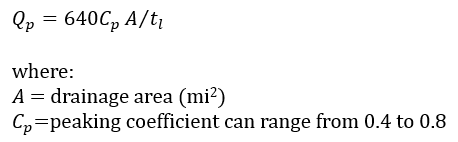
Snyder’s Unit Hydrograph is based on peak discharge and watershed lag. These parameters are estimated based on empirical equations which are shown below. It is worth noting that this method was developed based on a study of watersheds ranging from 10 square miles to 10,000 square miles in the Appalachian Highlands. The Snyder Unit Hydrograph estimation method is not as common as the Clark Unit Hydrograph and NRCS (SCS) Dimensionless Unit Hydrograph methods.
Watershed Lag (hr)
Peak Discharge (cfs)
NRCS (SCS) Unit Hydrograph
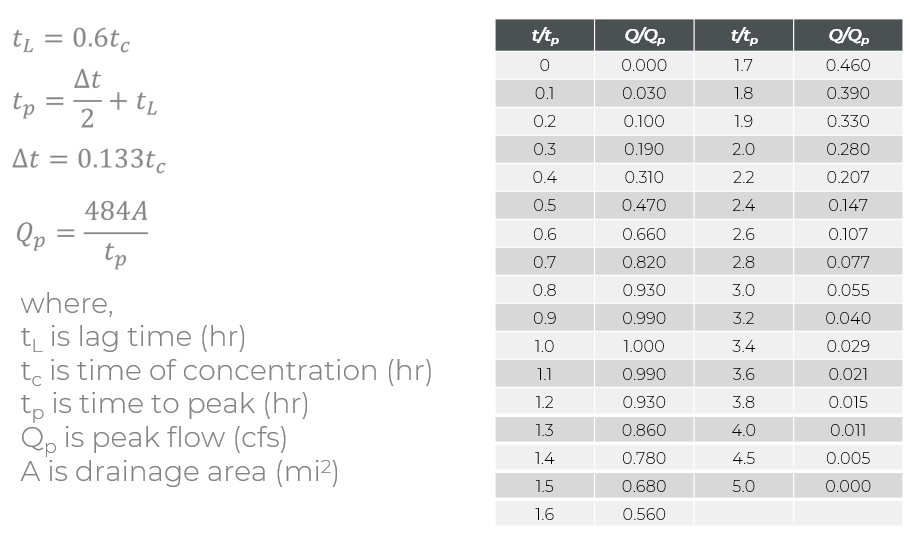
The NRCS analyzed many unit hydrographs derived from rainfall and runoff records for a variety of drainage basins scattered throughout the United States. Based on this information, they developed an average dimensionless unit hydrograph. This means the times on the horizontal axis are shown as t/tp (time to peak) and the values shown on the y-axis are Q/Qp or flow over peak flow. To apply the dimensionless unit hydrograph method, first estimate the lag time, which is approximated as 0.6 times the time of concentration. The equations used to develop an NRCS Dimensionless Unit Hydrograph are shown below. It is worth noting that, conceptually, lag time is defined in the same way as the Synder Unit Hydrograph methodology. However, the equations used to calculate these parameters are different.
Generating a Synthetic Hydrograph Using a Unit Hydrograph
Estimating a complete runoff hydrograph is useful for assessing the effects of storage facilities such as detention ponds and lakes. It is also useful for determining how various storm events can impact runoff. The following section summarizes how to generate a synthetic hydrograph using unit hydrograph estimation methods.
Step 1: Establish a design storm rainfall hyetograph. A hyetograph represents rainfall intensity over time. In the United States, SCS dimensionless storm distributions are often used for this purpose. Some municipalities have their own design storm distributions. For example, some cities in Indiana apply the Huff Distribution. In some instances, a modeler may even be able to use actual rainfall data to generate an outflow hydrograph.
Step 2: Convert the design storm rainfall hyetograph to a runoff (also referred to as effective rainfall) hyetograph. The SCS Curve Number Method is a widely used method to estimate runoff. Alternatively, losses can be calculated by estimating infiltration by applying the Horton Infiltration Equation or the Green and Ampt methodology.
Step 3: Generate a unit hydrograph for the drainage area. Three unit hydrograph estimation methods are described in the sections above (Clark Unit Hydrograph, Snyder Unit Hydrograph, and the NRCS (SCS) Dimensionless Unit Hydrograph).
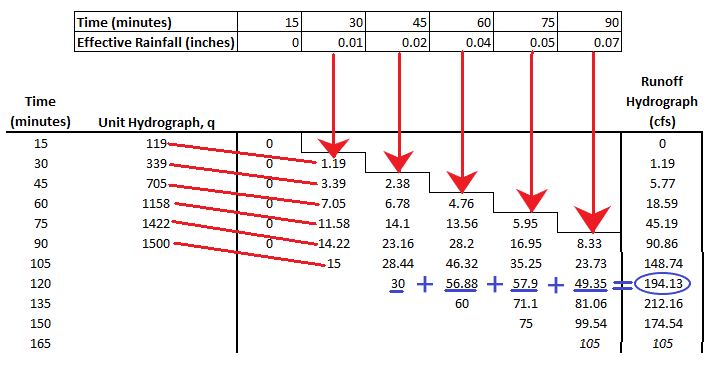
Step 4: Next, merge the runoff (effective rainfall) hyetograph and the unit hydrograph using discrete convolution. Discrete convolution involves applying the unit hydrograph (Step 3) to each discrete time step within the effective rainfall hyetograph (Step 2). In the image below, you can see that the first effective rainfall depth ordinate (0) is multiplied by each unit hydrograph ordinate (q). This process is repeated for each of the subsequent effective rainfall depths. Finally, the flow ordinates generated by multiplying effective rainfall and q are summed across each row. This will produce a direct runoff hydrograph as shown in the right-hand column of the image below.
Step 5. If necessary, add base flow to the direct runoff hydrograph to obtain a total hydrograph that includes both surface flow and base flow.